
Mass applying to jobs does two things in the data we can check: each application is worth less, and the total goes up. Both sides of this argument are right, and most of what we read for this search reports only one side. At one staffing team, from 14 September to 31 October 2026, recruiters applying by hand earned 4.4 human callbacks per 1,000 applications and ApplyEze earned 2.7. ApplyEze brought about three times as many in total, 171 against 58, and the gap narrowed through the fall.
We make ApplyEze. The useful question is which effect wins for you, and what volume costs beyond those counts.
The question, stated fairly
Two claims get argued past each other. One says mass applying is self-sabotage, because recruiters can tell and quality collapses. The other says it is a numbers game, so send everything. Dice's guide lays out the usual pros and cons with no measured number at all, and that is typical.
Volume and carelessness are also separate things that travel together. A person can send many applications that all fit, or a few that do not. The data below measures volume. It cannot fully separate the two, and we say where that matters.
One staffing team, both ways
A human callback here means a screening call, an interview or an offer. "By hand" means that team's recruiters choosing roles and applying themselves. It does not mean a job seeker spending an evening on one application, and this data says nothing direct about that person.
| Applied in | ApplyEze applications | Callbacks | Per 1,000 | By hand applications | Callbacks | Per 1,000 |
|---|---|---|---|---|---|---|
| 14 to 30 Sep | 5,245 | 8 | 1.53 | 7,429 | 39 | 5.25 |
| 1 to 15 Oct | 17,619 | 35 | 1.99 | 3,844 | 12 | 3.12 |
| 16 to 31 Oct | 39,968 | 128 | 3.20 | 2,038 | 7 | 3.43 |
| Whole window | 62,832 | 171 | 2.72 | 13,311 | 58 | 4.36 |
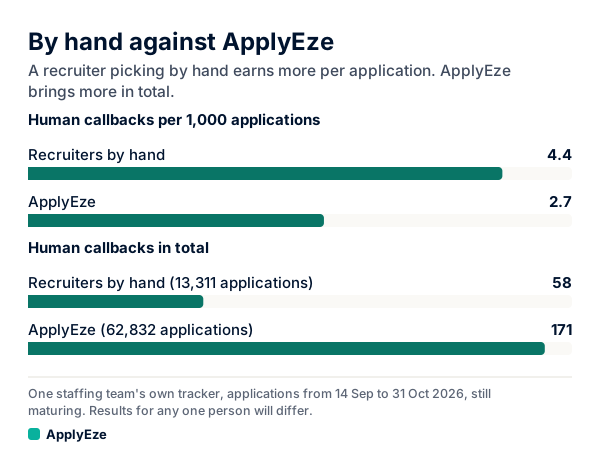
The chart holds the two comparisons: 4.4 against 2.7 per 1,000 applications, and 58 against 171 in total. A recruiter picking by hand earned more per application. In the last two weeks of October the rates were close, 3.2 against 3.4, though that by-hand figure rests on 7 callbacks and October applications are still maturing. ApplyEze's own rate rose from 1.5 to 3.2 per 1,000 across the window, and it brought about three times as many callbacks in total. The hand-picked comparison shows how the counts were cleaned.
The longer record shows a similar shape, with larger caveats.
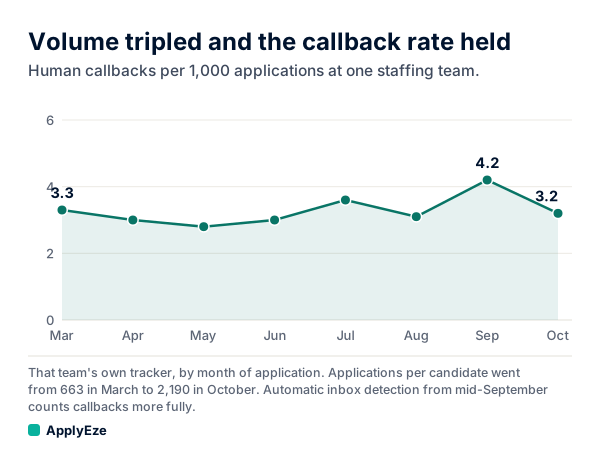
That chart counts everything the team logged, from all sources, by the month of the application. Applications rose from 7,288 in March 2026 to 63,508 in October, and the rate stayed near 3 per 1,000 (3.3 in March, 3.2 in October). Per candidate, human callbacks went from about 2 a month in spring to 7 for October applications, while applications per candidate rose from 663 to 2,190. Three things travel with that:
- The team's tracker began detecting replies from inboxes in mid-September. Before that, recruiters logged callbacks by hand, so part of the rise is better counting.
- Screening calls were barely logged before about July.
- It is one team. Results for any one person will differ.
Same people, busier weeks: Huntr's data
The strongest outside evidence comes from Huntr's Q3 2026 report, because it compares people with themselves: "We compared the same 4,456 job seekers across their own weeks." In weeks at 3 or more times their usual pace, the interview rate fell from 9.5% to 5.6%, and interviews per month rose from 0.7 to 2.9. Usual weeks averaged 2.5 applications, and the busiest averaged 17.5.
Set the two sources side by side as multiples, and the shape repeats (our arithmetic):
| Comparison | Volume multiple | Rate multiple | Total multiple |
|---|---|---|---|
| Huntr: the same people, usual weeks to busiest weeks | 7.0 | 0.59 | 4.1 |
| One staffing team: by hand to ApplyEze | 4.7 | 0.62 | 2.9 |
Compare only the multiples. Their levels cannot be compared at all: Huntr's rate is users logging an interview, ours is human callbacks at a staffing team, and the populations differ. And nothing says the pattern holds at far higher volume. Huntr's busiest week was 17.5 applications. The team's October figure of 2,190 per candidate is about 500 a week (our arithmetic).
This gives you a test you can run. Volume wins as long as the rate multiple stays above 1 divided by the volume multiple. At 5 times the applications, you break even if your rate falls to one fifth. Below that, you are doing more work for less.
A worked example, with invented numbers. Twenty well-chosen applications a week at a 6% interview rate gives 1.2 interviews. A hundred broader ones break even at a 1.2% rate. Above that, the extra volume helped. Below it, you spent time and goodwill for nothing.
What most people miss is that the average hides the extra applications. If a busy week is the usual 2.5 plus 15 more, those extra 15 in Huntr's data converted at roughly 5%, about half the usual rate (our arithmetic: 17.5 at 5.6% less 2.5 at 9.5%, over 15). That is still a working rate at that volume. It tells you the extras are worth less, and it says nothing about application number 500.
Huntr adds its own limit: same-person comparisons "do not remove differences in timing or in the jobs people chose", and its rates "do not prove that any choice caused an interview". Its across-people figures point the same way and carry more selection: users with 11 to 20 applications in Q3 had 8.0% per application with 47.8% getting at least one interview, while those above 100 had 2.4% with 72.0% getting at least one.
What volume does to employers
Ashby reports 291 applications per hire, from roughly 100 in early 2021. Robert Half found 67% of US HR leaders say reviewing AI-generated applications has slowed hiring, with 20% reporting delays of more than two weeks. Greenhouse's 2025 survey has 34% of recruiters spending up to half their week filtering spam and junk. All three sell hiring products or staffing, and the direction is still clear.
Two working papers explain the mechanism, and it applies to everyone. Studying one large labor platform, Cui, Dias and Ye found an AI cover letter tool "raised callback rates" while "the correlation between cover letters' textual alignment and callbacks fell by 51%". Tailoring still helped the person using it, and it told the employer less, so employers leaned more on other signals such as work history. Galdin and Silbert, using Freelancer.com data, found employers paid more for customized applications before these models arrived and not after. Their simulation has top-quintile workers hired 19% less often and bottom-quintile workers 14% more often. That is a model of a freelance market, not the job market you are in. It does describe what happens when the signal gets cheap: each person gains, and the market gets worse at telling people apart.
Indeed saw the same thing from the platform side. Testing an automatic application mode in July 2026, it wrote that "employers are rightfully concerned about tools that encourage high-volume, low-relevance applications", and by 4 August it had paused that mode.
What volume can do to your name
Here the evidence gets concrete, and then it runs out.
Rules can block you. Ashby's application limits "automatically block excessive applications" and can stop rejected candidates reapplying to any role in a scope for a set number of days. Greenhouse offers similar limits. Each employer sets its own numbers, and you usually will not see them. So the real cost of a bad application may be the good one it blocks later.
Rules can reject you on an answer. Ashby's auto-reject acts at submission, on conditions such as an answer to a location question.
Repeats lose value, though they do not end your chances. In Huntr's data, 8 or more applications to one company had a 2.4% interview rate per application against 5.9% for one. People who did that still got at least one interview there 17.7% of the time. So it is not fatal, just increasingly wasteful.
Mistakes repeat. A wrong saved answer goes out on every form until you notice.
Your accounts are at risk on some platforms. LinkedIn says members using third party automation "risk having their accounts restricted or shut down".
Beyond that, we found nothing measured. No study we read shows that recruiters keep lists of mass appliers, or how they treat a well-matched automated application against a typed one. We would distrust a confident claim in either direction.
What to filter out even at volume
ApplyEze Autopilot, our team product, puts an AI judge between a shortlist and the form. In the 14 days to 9 November 2026 it scored 259,378 roles, and 50,609 reached the default pass mark of 6, or 19.5%. So it turned down about 4 of every 5 roles it was offered, with a median of 4.9 minutes from shortlist to verdict over the last 7 days, and a team can raise the bar per candidate. On 20 October 2026 a separate model re-judged 601 of its decisions without seeing the verdict and agreed on 83.5%, which is one model checking another, not a panel of recruiters.
Autopilot is set up today for staffing and recruiting teams that work with ApplyEze. If you are job hunting on your own, you can start with 50 free applications on sign-up, no card needed. You pick the matches and queue them in the desktop app, and ApplyEze fills and submits each form. On that path the choosing is yours, and its rubric is easy to borrow by hand:
| Score | What it means |
|---|---|
| 10 | Squarely a target role at your level |
| 7 to 9 | A close neighboring role you could do now |
| 5 or 6 | Plausible on paper, but a reach |
| 0 to 4 | A different field, or a level far above or below |
Asking 3 or more years beyond yours is a level gap, and 5 or more is far above you. Use the rubric to protect an employer's time and your own name.
So, at any volume, leave out:
- Roles in a different field or far from your level. These are the 0 to 4 band, and they are where the slot-burning risk is highest.
- Roles requiring a credential you lack. ApplyEze skips a posting requiring a clearance you lack. Otherwise it does not add a certification you do not hold, so the application goes out without it.
- Knockouts you would honestly fail, such as a location the employer states it requires.
- Second and third roles at one employer, unless they are truly different. ApplyEze limits how often it applies to the same employer, and you should think the same way.
- The employers you most want. Apply to those by hand, with a referral if you can get one.
- Employers that ask you not to. Some employers ask applicants not to use AI or automation. Whether to apply there is your call.
Sponsorship needs your own attention. ApplyEze does not skip a job because the posting says it will not sponsor, and sponsorship questions use the answers you saved. So that filter is yours too.
For how much to send, how many jobs to apply to a day works through daily targets, and how many applications it takes to get a job has a funnel for your own numbers.
How to test it on your own search
These are team numbers, not a free user's result, and results for any one person will differ. One team, with its recruiters and its candidates, is not a randomized test, and Huntr's data is self-tracked and observational. In both datasets the higher-volume side had the lower rate per application and the higher total, so measure both numbers on your own search.
Set your usual pace, choose only roles you would defend under the rubric, raise your volume for two weeks, and run the break-even test above. If you would rather spend those weeks preparing for interviews than retyping forms, your first 50 applications are free, with no card. You pick the matches and queue them in the desktop app, and ApplyEze builds a resume for each posting and submits each form while your computer stays on and awake. Workday and Oracle jobs stay hidden until you connect an application inbox, and a credit is used only when an application is confirmed as Submitted.