
Hand picked vs automated job applications, measured at one staffing team: from 14 September to 31 October 2026, a recruiter picking by hand earned 4.4 human callbacks per 1,000 applications, and ApplyEze earned 2.7. ApplyEze brought about three times as many callbacks in total, 171 against 58, because it sent almost five times as many applications, and the gap narrowed as the fall went on. The person won on each application and the software won on the pile.
The rest of this post shows how those counts were cleaned (one filter can more than double a rate), why a recruiter leads per application, why the total favors volume, and six questions to put to anyone quoting a rate like this.
Both numbers, side by side
| Applied 14 Sep to 31 Oct 2026 | By hand | ApplyEze |
|---|---|---|
| Applications | 13,311 | 62,832 |
| Human callbacks | 58 | 171 |
| Callbacks per 1,000 applications | 4.36 | 2.72 |
| Applications per callback | about 230 | about 367 |
A human callback is a screening call, an interview or an offer. Assessment invitations are counted apart, because most are sent automatically.
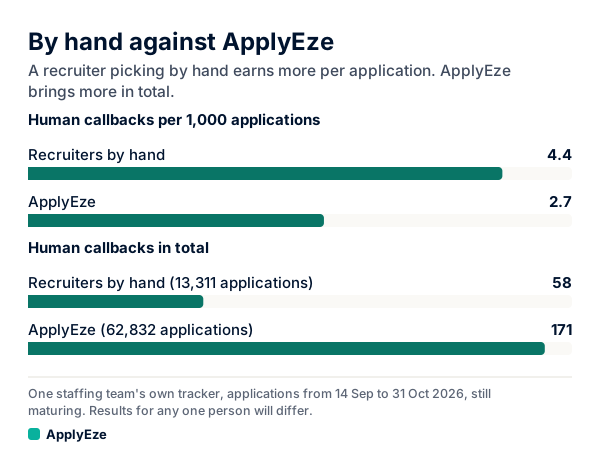
The chart holds the same two comparisons: 4.4 against 2.7 per 1,000 applications, and 58 against 171 in total.
"By hand" has a specific meaning here. These are recruiters at a staffing team choosing roles for their candidates and applying themselves. They sent 7,429 applications in the 17 days to 30 September, about 437 a day across the team. That is a production line run by people who know the candidates. It is not a job seeker spending an evening on one application, and this data says nothing direct about that person.
How the counts were cleaned
The comparison starts on 14 September because that is when the team's own tracker began detecting replies from candidates' inboxes. Before that, recruiters logged callbacks by hand, which makes earlier rates unfair to any application a recruiter did not send.
Two kinds of row were left out of both sides:
- Rows that exist only because an inbox reply was found. The application appears in the tracker because a reply arrived, so it can never be a miss.
- Candidates' own logged applications. A candidate's own application usually reaches a team's tracker because something happened on it.
Both bring a callback with almost no denominator. October shows how much that matters. The team's month-by-month table has 63,508 applications and 204 human callbacks for October. The cleaned table adds up to 63,469 applications (57,587 through ApplyEze, 5,882 by hand) and 182 callbacks (163 and 19). The difference is 39 rows holding 22 callbacks, which we read as the rows left out. Now file them on one side or the other:
| October applications | Applications | Callbacks | Per 1,000 |
|---|---|---|---|
| By hand, cleaned | 5,882 | 19 | 3.23 |
| By hand, with those 39 rows | 5,921 | 41 | 6.92 |
| ApplyEze, cleaned | 57,587 | 163 | 2.83 |
| ApplyEze, with those 39 rows | 57,626 | 185 | 3.21 |
Thirty-nine rows, under 1% of the by-hand pile, would more than double the by-hand rate. Filed the other way, they would lift ApplyEze's rate by about 13%. Anyone comparing two sources has this lever, and it usually sits in a spreadsheet filter no reader ever sees. Here those rows sit on neither side.
One bias remains. A recruiter who sent an application is more likely to notice and log its reply than a recruiter looking at one the software sent. If that still happens after 14 September, it flatters the by-hand side.
Why a person leads per application
We have not measured the reason. The mechanism points to context.
A recruiter knows things that never reach a form: what a candidate said on the phone, which employers answered them last month, which role they would actually take. ApplyEze Autopilot's AI judge works from a defined set of inputs. For each role it reads the title, the company, the first 2,000 characters of the description, the parsed years and level, and up to three later sentences stating years of experience. About the person it reads target roles, role families, level, years, a new-grad flag, skills and past job titles. It is told to judge "as a careful recruiter who knows them would". In the 14 days to 9 November 2026 it turned down about 4 of every 5 roles its shortlist offered, and in the last 7 of those days the median role was judged 4.9 minutes after being planned. A team can raise the bar per candidate.
Two audits suggest the recruiter's lead is not about fit on paper. On 20 October, a separate, stronger model re-judged 601 of the judge's decisions without seeing the verdict and agreed on 502, or 83.5%. On 26 October, a blind audit had a separate model read 193 applications and ask "would a recruiter have sent this?" It passed 84% of Autopilot's and 69% of the hand-picked ones. The sample is small, it is a model's reading and not a recruiter's, and Autopilot is part of the ApplyEze column above, not all of it. Whatever a recruiter adds per application goes beyond the page, and it is a good reason the team kept doing both.
All the ApplyEze figures in this post are team numbers, not a self-serve result. Autopilot is set up today for staffing and recruiting teams that work with ApplyEze. If you are job hunting on your own, you can start with 50 free applications on sign-up, no card needed. You pick the matches and queue them in the desktop app, and ApplyEze fills and submits each form. That path runs on your computer, which stays on and awake until the queue finishes, and Workday and Oracle roles need a connected application inbox. We publish no callback rate for self-serve accounts.
Why the total still favors volume
To match 171 callbacks at the by-hand rate, those recruiters would have needed about 39,244 applications (171 ÷ 58 × 13,311), roughly three times what they sent. That assumes their rate holds at triple the pace, which is generous. Huntr's same-person data shows rates falling when people speed up.
Now price it in hours. The lowest figure we can source for one application is a timed 2022 audit of Fortune 500 forms: 4 minutes 52 seconds, first click to confirmation, with no time counted for tailoring or choosing the role. At that speed 39,244 applications is about 3,183 hours. Over 48 days that is about 66 hours a day, or about eight people working eight hours every day, weekends included, doing nothing else. Asked about the whole job, tailoring included, US job seekers in a 2026 survey said about 44 minutes per application. ApplyEze's median was 2.5 minutes from a lane picking up a role to the application going in, across 17,994 applied runs in the 7 days to 9 November 2026, and those minutes are a machine's.
So a rate comparison hides the real constraint, which is hours. Recruiter hours are not in this data, so callbacks per recruiter hour is the number this table cannot give. What it does show is that the two were never alternatives. Hand-picked volume fell through the window while ApplyEze's rose, and the team kept doing both. How a team divides that work is in recruiting automation.
Volume has a cost on the employer's side. Robert Half reports that 67% of US HR leaders say reviewing AI-generated applications has slowed hiring, and Ashby now offers customers application limits that "automatically block excessive applications". ApplyEze limits how often it applies to the same employer, and Autopilot's judge turns down most of what its shortlist offers. Our fuller look at that side is in mass applying to jobs.
If you apply for yourself, here is how we would split the work. This is our judgment from the mechanism above, not a measured result.
| The role | What we would do | Why |
|---|---|---|
| One you would hate to miss, or where you can reach a person | By hand, and look for a referral | One application's odds matter more than the count |
| Fits your target titles, one of many like it | Automation fits, and read your receipts | The volume gap here is larger than the rate gap |
| A long shot you are unsure about | By hand with a reason, or skip it | This is where reading the whole person should add most |
| An employer that asks applicants not to use AI or automation | Your call | Some employers ask this, and whether to apply there is up to you |
Huntr's own advice fits that table: "send more applications only when you can still match each one to the job."
What this does not say about any one person
It is one team, with 29 candidates by October, and it is not a randomized test. Nobody split identical roles between recruiters and software, so the two sides may have had different roles and different candidates. The dates are not evenly weighted either. About 56% of by-hand applications went out in late September, while about 64% of ApplyEze's went out in late October, so each side's average leans on a different part of the fall.
The gap also narrowed. In the last two weeks of October the rates were close, 3.2 through ApplyEze against 3.4 by hand. That by-hand figure rests on 7 callbacks, and October applications are still maturing. Read it beside the whole-window 4.4 against 2.7. The callback gap post has all three periods.
Outside evidence on these tools is thin and mixed. In Huntr's Q3 2026 survey, 68 of 329 respondents had used a tool that sends applications for them. Six got more interviews than when they applied themselves, 33 about the same, 17 fewer and 12 were not sure, and 40 have stopped. It is a small, self-selected group, and Huntr states that it cannot measure these tools directly. Greenhouse's October 2026 survey of 1,200 US job seekers found that about seven in ten would be comfortable using an AI agent, but "only 5% would let one apply to jobs on its own". We found nothing that measures how employers treat a well-matched automated application differently from a typed one.
Results for any one person will differ, and no rate here predicts yours.
How to read a vendor's rate after this
Search this topic and most of what you find comes from companies selling one side. Scale.jobs, a human-assisted application service that competes with products like ours, says in a post dated 3 November 2025 that "automated bots achieve callback rates below 2%" and that "human-crafted applications consistently deliver callback rates between 25-47%". The page gives no sample size, date range, definition of a callback or method. That does not make the figures false. It means nobody can check them. The direction agrees with our table, and the size cannot be tested.
Here are six questions for any such claim, answered for this post.
| Ask | Why it matters | This post |
|---|---|---|
| What counts as a callback? | Assessment invitations are mostly automatic and flatter any rate | Screening, interview or offer. Assessments apart |
| Did any row exist because a reply arrived? | 39 such rows can double a rate | Left out of both sides |
| Were both sides measured over the same dates? | One side's good month can carry the average | Same 48 days, weighted differently, as stated above |
| How many callbacks sit under the rate? | Under about 10, one reply moves it a lot | 58 and 171. Late October by hand: 7 |
| How old are the applications? | Replies lag, so young applications read low | Some were only 9 days old when measured |
| Who chose the roles, and were the groups comparable? | Otherwise the gap may be about the groups | Not randomized, and stated as such |
A vendor who can answer all six has given you something to argue with. One who cannot has given you a slogan.
So here is where the table leaves you. Across the whole window a recruiter picking by hand earned more callbacks per application, 4.4 against 2.7 per 1,000. ApplyEze brought about three times as many in total, 171 against 58, and the gap narrowed through the fall. If you apply for yourself, keep the roles you would hate to miss for your own hands and let software carry the rest: your first 50 applications are free, no card needed.