

The callback gap between hand-picked applications and ApplyEze applications narrowed sharply this fall at one staffing team: 5.25 against 1.53 human callbacks per 1,000 applications in late September, 3.12 against 1.99 in early October, and 3.43 against 3.20 in late October. Across the whole window, by hand leads 4.4 against 2.7, and ApplyEze brought about three times as many callbacks in total, 171 against 58. The late by-hand figure rests on 7 callbacks and those applications are still maturing. ApplyEze's rests on 128.
A note on the term. In research, "callback gap" usually means something else: the difference between matched fictitious applicants in a randomized audit. Kline, Rose and Walters sent more than 83,000 such applications to 108 of the largest US employers and found "distinctively Black names reduce the probability of employer contact by 2.1 percentage points". That design can support a causal claim. Ours is a record of real work at one team, and this post shows what that can settle.
Three periods, side by side
A human callback is a screening call, an interview or an offer. Assessment invitations are counted apart, because most are sent automatically. Inbox-only rows and candidates' own logged applications are left out of both sides, for reasons shown in our hand-picked comparison.
| Applied in | By hand, per 1,000 | ApplyEze, per 1,000 | Gap | By hand, callbacks of applications | ApplyEze, callbacks of applications |
|---|---|---|---|---|---|
| 14 to 30 Sep | 5.25 | 1.53 | 3.72 | 39 of 7,429 | 8 of 5,245 |
| 1 to 15 Oct | 3.12 | 1.99 | 1.13 | 12 of 3,844 | 35 of 17,619 |
| 16 to 31 Oct | 3.43 | 3.20 | 0.23 | 7 of 2,038 | 128 of 39,968 |
| Whole window | 4.36 | 2.72 | 1.64 | 58 of 13,311 | 171 of 62,832 |
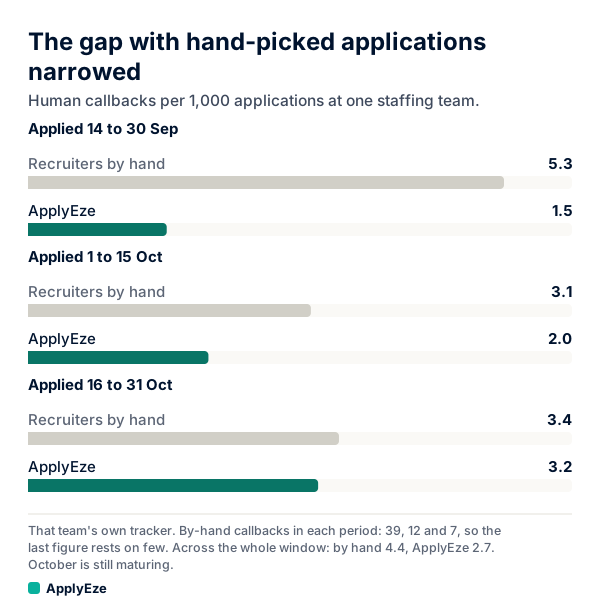
The chart shows the three periods from the table: the two bars start far apart and finish nearly level.
Both sides moved. The gap closed by 3.49 points, from 3.72 to 0.23. ApplyEze's rate more than doubled, up 1.67 points from 1.53 to 3.20, on more than seven times the applications. The by-hand rate came down 1.82 points, from 5.25 to 3.43, on about a quarter of the applications. Any time you see "the gap closed", ask which side moved.
The whole window, always
We never quote the late-October pair alone, because a chosen end point can make almost any trend look finished. Over all 48 days, a recruiter picking by hand earned more callbacks per application, 4.4 against 2.7 per 1,000. ApplyEze brought about three times as many in total, 171 against 58.
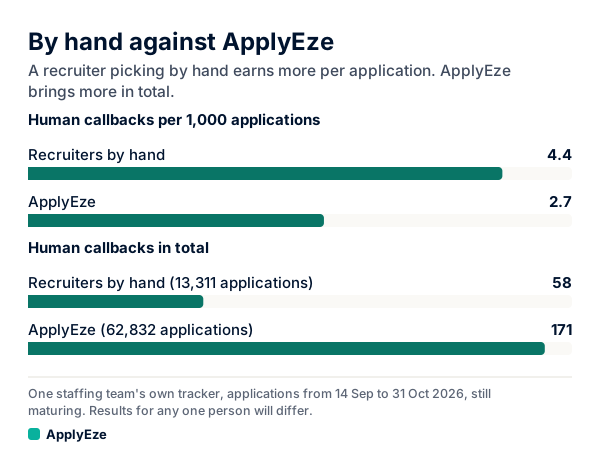
Each side's average leans on its own busiest period. About 56% of by-hand applications went out in late September, and about 64% of ApplyEze's went out in late October. That is why the whole-window figure travels with every mention of the late one, and why the three periods travel with the whole window.
Why 7 callbacks is thin
Late October by hand is 7 callbacks on 2,038 applications. One callback there is worth 0.49 per 1,000, more than twice the whole remaining gap of 0.23. With 6 callbacks the by-hand rate would be 2.94, and ApplyEze would lead. With 8 it would be 3.93, and the gap would look wide again.
Call that the one-callback test, and use it on your own search. Add one reply and take one away. If your conclusion flips either way, you do not have a conclusion yet.
The start of the trend is thin too, since ApplyEze's late-September 1.53 rests on 8 callbacks. Here is the uncertainty on every cell (our arithmetic: exact Poisson 95% ranges, treating callbacks as independent):
| Applied in | By hand, per 1,000 | ApplyEze, per 1,000 |
|---|---|---|
| 14 to 30 Sep | 5.25 (3.73 to 7.18) | 1.53 (0.66 to 3.01) |
| 1 to 15 Oct | 3.12 (1.61 to 5.45) | 1.99 (1.38 to 2.76) |
| 16 to 31 Oct | 3.43 (1.38 to 7.08) | 3.20 (2.67 to 3.81) |
| Whole window | 4.36 (3.31 to 5.63) | 2.72 (2.33 to 3.16) |
Read the late-October row. ApplyEze's 3.20 rests on 128 callbacks and runs from 2.67 to 3.81. By hand's 3.43 rests on 7 and runs from 1.38 to 7.08. The two cannot be told apart, and ApplyEze's is the sturdy number of the pair. Over the whole window the ranges do not overlap, so by hand's lead there is firm.
Did the relationship really change? By hand led about 3.4 times over in late September and about 1.07 times in late October. A rough test puts that change at about 2 standard errors (our arithmetic). That is suggestive evidence of a real shift, and callbacks cluster within the same candidates and employers, so the true uncertainty is larger than this.
Why October is still maturing
These numbers were read on 9 November. Late-September applications had been out for 40 to 56 days, and late-October ones for 9 to 24 days.
Replies lag. For applications from 12 to 23 October, 58 human callbacks arrived at a median of 116 hours, with 38% inside 72 hours and 74% inside 7 days. So late October will rise on both sides, and most of the rise should already be in.
If both sides rose in proportion, the ratio would hold. ApplyEze's applications may sit younger, though. Across all of ApplyEze, the week of 26 October was far larger than the week before it, 25,102 applications against 16,958. If this team's ApplyEze applications bunched late in the period, that figure has further to climb. We have not split that yet at this team.
What could explain the change
Each of these could produce the pattern. Each also predicts something different, which is how they can be told apart.
| Explanation | How it would narrow the gap | What we would see if it is the main cause |
|---|---|---|
| ApplyEze changed | The software changed during these weeks, including how roles get picked | ApplyEze's rate rises for the same candidates at the same age |
| What recruiters chose | Hand-picked volume fell from about 437 applications a day to about 127. The roles or candidates they kept for hand work may have changed | The by-hand fall shrinks when the same candidates are compared |
| Crowding | ApplyEze's share of these applications rose from 41% to 95%, and it applies fast. A recruiter arriving later may find the closest matches already sent | By-hand applications go to older postings over time |
| Counting | Inbox detection in the team's own tracker began on 14 September. If a recruiter was more likely to log replies to their own applications, early ApplyEze callbacks were undercounted | Early ApplyEze rates rise when counted from inbox evidence alone |
| Candidate mix | The team had 22 candidates in September and 29 in October | The trend fades on a fixed panel of candidates |
| Young applications | Late October has not had time | The pattern changes when age is held equal |
| Chance | 8 and 7 callbacks sit at the two ends | The gap reopens as counts grow |
Here is what the picking looks like today. In the 14 days to 9 November, ApplyEze Autopilot's AI judge turned down about 4 of every 5 roles its shortlist offered, with a median of 4.9 minutes from planned to judged over the last 7 of those days. On 20 October a separate, stronger model re-judged 601 of its decisions blind and agreed on 83.5%. That shows how the system works. This table cannot separate the explanations above, so we attribute the change to none of them yet.
These are team numbers, and none of them is a self-serve result. Autopilot is set up today for staffing and recruiting teams that work with ApplyEze. If you are job hunting on your own, you can start with 50 free applications on sign-up, no card needed. You pick the matches and queue them in the desktop app, and ApplyEze fills and submits each form. That path runs on your computer, which stays on and awake until the queue finishes, and Workday and Oracle roles need a connected application inbox. Results for any one person will differ.
What a clean test would look like
The audit design at the top of this post is the model. To measure this gap with a causal claim, you would take one candidate's eligible roles, assign each role at random to a recruiter or to the software, and count replies at the same age. Random assignment removes the arguments about who picked what. The table above is two streams of real work that happened to overlap, which is why it can show the gap narrowing and cannot yet say why.
What we will check next
- Equal age. Recompute all three periods counting only callbacks within the same number of days of the application. This removes most of the maturing problem.
- Fixed panel. Keep only candidates with both kinds of application in every period. This tests the mix and recruiter-choice rows.
- Same evidence. Count both sides from inbox evidence alone, leaving out hand-logged callbacks. This tests the counting row.
- Posting age. Compare how old a posting was when each side applied. This tests crowding.
For how the team's overall rate behaved over a longer stretch, see callback rate at volume, and for the per-candidate view, including the stage each reply reached, see callbacks per candidate.
What to take from this
Three habits carry over to your own search. When a gap closes, ask which side moved. Before you trust a rate, run the one-callback test. And hold age equal, leaving out applications too young to have had a reply.
Across the whole window, a recruiter picking by hand earned more callbacks per application, 4.4 against 2.7 per 1,000. ApplyEze brought about three times as many in total, 171 against 58, and the gap narrowed through the fall. If you are running your own search and want more applications in play without the evenings they take, your first 50 are free, no card needed.