

Callbacks per candidate counts how many of one month's applications brought a human reply, per person applying. At one staffing team it rose from about 2 a month in spring to 7 for October applications, while the rate per 1,000 applications held at about 3. Volume rose more than threefold and the rate did not fall. Part of the rise is better counting, and screening calls were barely logged before about July. Counting interviews alone, the figure is flat so far, 2.1 in March and 2.1 in October, with October still maturing and many applications at the screening stage. It is one team, and results for any one person will differ.
From about 2 to 7, in one line of arithmetic
Callbacks per candidate is the product of two things:
Callbacks per candidate = applications per candidate × callbacks per application
March: 663 × 3.3 per 1,000 = 2.2. October: 2,190 × 3.2 per 1,000 = 7.0. Applications per candidate rose 3.3 times, the rate barely moved, and callbacks per candidate rose 3.2 times.
You can test that on all eight months. The last column below ignores everything except volume: it multiplies each month's applications per candidate by October's rate of 3.2 per 1,000, so October matches by construction.
| Applied in | Candidates | Applications per candidate | Per 1,000 | Callbacks per candidate | Volume alone predicts |
|---|---|---|---|---|---|
| Mar 2026 | 11 | 663 | 3.3 | 2.2 | 2.1 |
| Apr 2026 | 13 | 749 | 3.0 | 2.2 | 2.4 |
| May 2026 | 17 | 586 | 2.8 | 1.6 | 1.9 |
| Jun 2026 | 18 | 500 | 3.0 | 1.5 | 1.6 |
| Jul 2026 | 13 | 1,003 | 3.6 | 3.6 | 3.2 |
| Aug 2026 | 17 | 787 | 3.1 | 2.4 | 2.5 |
| Sep 2026 | 22 | 970 | 4.2 | 4.1 | 3.1 |
| Oct 2026 | 29 | 2,190 | 3.2 | 7.0 | 7.0 |
Six of the other seven months land within 0.4 of what volume alone predicts. September is the exception, a full callback above it. So the driver here is more applications at about the same return. That is what a candidate is after, since replies are the goal, and a return that does not fall as volume rises is its own unusual finding.
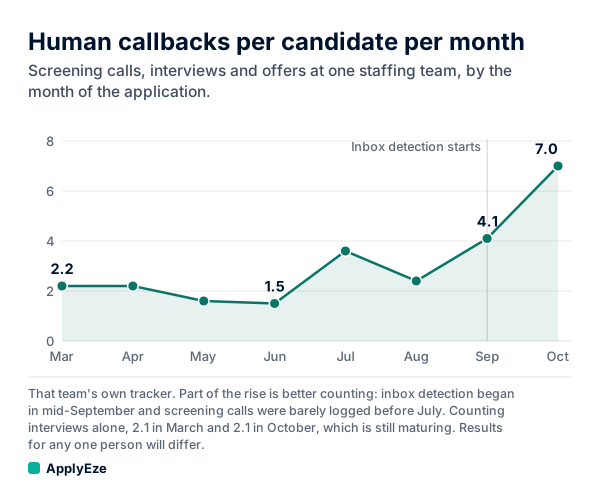
The chart draws the "callbacks per candidate" column: 2.2 in March, a low of 1.5 in June, then 3.6, 2.4, 4.1 and 7.0.
What counts as a human callback
The definition does a lot of work, so here it is in full.
- Three stages count: screening call, interview, offer. Assessment invitations are counted apart, because most are sent automatically.
- One application counts once. The table uses each application's latest stage. A candidate who goes from screening to interview to offer at one employer adds one callback, not three. So "7 callbacks" means 7 applications with human contact, not 7 phone calls.
- Replies go back to the month of the application. A reply in November to an October application counts in October. That makes the recent months incomplete, and it stops a busy month from borrowing replies earned earlier.
- Everything the team logged is in. That includes callbacks on candidates' own applications, which keeps the spring numbers high and the rise conservative.
If you came here from a recruiting glossary, note that "candidate call back rate" often means something else. Keka's definition divides candidates' return calls by the recruiter's outreach calls. That measures whether candidates answer a recruiter. This measures whether employers answer a candidate.
Part of the rise is better counting
That team's own tracker began detecting replies from inboxes automatically in mid-September. Before that, recruiters logged callbacks by hand, and people miss things. So March to August is closer to a floor than a measurement.
How much could counting explain? For better counting alone to erase the rise, automatic detection would have to find about 3.2 times what hand logging found (7.0 ÷ 2.2). If it finds twice as much, October's 7.0 is 3.5 on the old ruler, still above spring's 2.2. Those are illustrations, not measurements, and we do not know the true figure.
The nearest thing to one ruler is September against October, and even September is half and half. On that comparison callbacks per candidate rose 1.7 times (4.1 to 7.0) on 2.3 times the volume (970 to 2,190), with October younger and its replies still arriving.
Screening calls before July
Counting interviews alone, per candidate, gives 2.1 in March and 2.1 in October. So March's 2.2 callbacks were nearly all interviews, and of October's 7.0, 2.1 are at the interview stage so far. The rest sit at screening or offer, and many sit at screening, the one stage that was barely logged before about July.
That leaves two readings, and the current data cannot separate them.
| Reading | What it would mean | What would support it |
|---|---|---|
| Screening calls really rose | Candidates are getting more first conversations, and more interviews should follow | October's interviews per candidate climb well past 2.1 as those applications mature |
| Screening calls were always there, unlogged | Spring's true count was higher than 2.2, and part of the rise is the ruler | October's interviews per candidate stay close to 2.1 |
Since each application counts at its latest stage, a screening call that becomes an interview moves over later, so October's 2.1 can still rise. The next few months will show which reading holds.
What it means that volume rose too
Because the number is a product, a team can raise it by sending more. So we report three figures together: callbacks per candidate, callbacks per 1,000 applications, and interviews alone per candidate. At this team in October that is 7.0, 3.2 and 2.1.
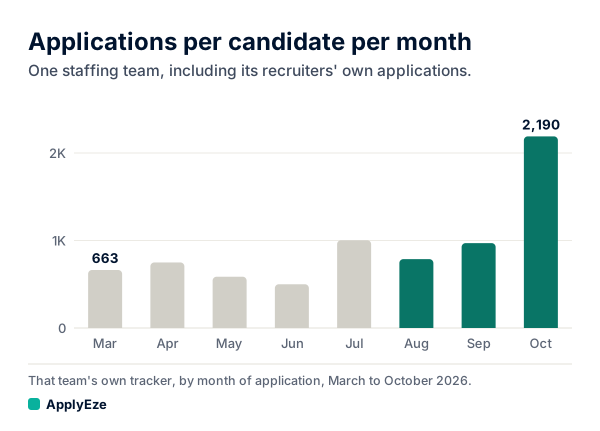
The chart shows that volume path: 663 in March, a low of 500 in June, then 2,190 in October, about 70 applications a day per candidate. Each of those applications lands on someone's desk. A 2025 Greenhouse report says "34% spend up to half their week filtering spam and junk applications", in its US findings on recruiters and hiring managers (Greenhouse sells hiring software). So volume has to be aimed. ApplyEze limits how often it applies to the same employer, and in the 14 days to 9 November 2026 ApplyEze Autopilot's AI judge turned down about 4 of every 5 roles its shortlist offered.
The per-candidate denominator moves too. The team went from 18 candidates in June to 13 in July, and from 11 in March to 29 in October, and the people in the group are not the same from month to month.
For the division the other way round, including how many applications stand behind each reply, see applications per callback.
Why this is one team, and no promise
We name no company and no candidate. One team has its own mix of fields, visas, seniority and recruiters, and nothing here says what you would see, at any volume. Results for any one person will differ.
The ApplyEze applications in this table came through a team setup that includes ApplyEze Autopilot. Autopilot is set up today for staffing and recruiting teams that work with ApplyEze, and how a team runs it day to day is its own post. If you are job hunting on your own, you can start with 50 free applications on sign-up, no card needed. You pick the matches and queue them in the desktop app, and ApplyEze fills and submits each form. That path runs on your computer, which stays on and awake until the queue finishes, and Workday and Oracle roles need a connected application inbox. We publish no callback figure for self-serve accounts.
How to keep this number yourself
Good counting starts with the log, so here is the one we would want, for one person or a team. The values are samples, not a real application.
| Field | Sample value | Why it is there |
|---|---|---|
| Applied on | 14 Oct | Group by this date, never the reply date |
| Sent by | Me, a recruiter or a tool | Keeps sources apart when you compare them |
| Latest stage | Screening | One stage per application, updated as it moves |
| First human reply | 19 Oct | Gives you your own lag |
| Evidence | Email, phone or portal | Shows when your counting changed |
| Assessment invited | Yes or no | Its own column, never part of the callback count |
Five rules go with it:
- One application is at most one callback, however many rounds it reaches.
- Do not report a rate that includes applications under two weeks old.
- Write down the date whenever the way you count changes.
- Log every application, not only the ones that got a reply. A few rows that exist because of a reply can more than double a rate, as our hand-picked comparison shows.
- Report applications, callbacks and interviews alone together.
On a self-serve ApplyEze account you record employer replies yourself on each application, and your Heard back and Interviews counts come from what you record, so these rules apply there too. If you want a log worth counting, your first 50 applications are free, no card needed.