

Applications per callback is applications divided by human callbacks. At one staffing team, from 14 September to 31 October 2026, 62,832 applications through ApplyEze brought 171 human callbacks, one per about 367. Recruiters picking by hand sent 13,311 applications and earned 58, one per about 230. ApplyEze brought about three times as many callbacks in total, and in late October it ran at about one per 312. Below is the arithmetic, the assumptions under it, and a way to plan your own volume without borrowing ours.
The number and the math
| Applied 14 Sep to 31 Oct 2026 | Applications | Human callbacks | Applications per callback | Per 1,000 |
|---|---|---|---|---|
| Through ApplyEze | 62,832 | 171 | 62,832 ÷ 171 = about 367 | 2.72 |
| By hand | 13,311 | 58 | 13,311 ÷ 58 = about 230 | 4.36 |
A human callback is a screening call, an interview or an offer. Rows that exist only because an inbox reply was found, and candidates' own logged applications, are left out of both sides. Our hand-picked comparison shows why that step matters so much.
It is the same data as a rate per 1,000, turned over. We like this direction because it shows the cost. "2.7 per 1,000" sounds abstract, while 367 is a number of forms.
You can price those forms. In the 7 days to 9 November 2026, across 17,994 applied runs, the median time from a lane picking up a role to the application going in was 2.5 minutes, and 4.9 minutes at the 90th percentile. So at the median, 367 applications is about 15 hours of software running per callback (367 × 2.5 ÷ 60). By hand, the lowest figure we can source is a 2022 timed audit of Fortune 500 forms at 4 minutes 52 seconds, with no time counted for tailoring. At that speed 230 applications is about 19 hours of a person's time per callback. Asked about the whole job, tailoring included, US job seekers in a 2026 survey said about 44 minutes per application, and at that pace 230 applications would be about 169 hours. These measure different things, so read them as orders of magnitude. The hours are of very different kinds: one set is a computer's, the other someone's working week.
How the number moved through the fall
| Applied in | By hand: applications per callback | By hand: callbacks behind it | ApplyEze: applications per callback | ApplyEze: callbacks behind it |
|---|---|---|---|---|
| 14 to 30 Sep | about 190 | 39 | about 656 | 8 |
| 1 to 15 Oct | about 320 | 12 | about 503 | 35 |
| 16 to 31 Oct | about 291 | 7 | about 312 | 128 |
| Whole window | about 230 | 58 | about 367 | 171 |
ApplyEze's figure halved. The by-hand figure moved the other way, from about 190 to about 291. The chart shows the same periods as rates, where a taller bar means fewer applications per callback: 5.3 and 1.5 per 1,000 in late September, 3.1 and 2.0 in early October, 3.4 and 3.2 in late October. Over the whole window, that is 4.4 by hand against 2.7 through ApplyEze per 1,000 applications.
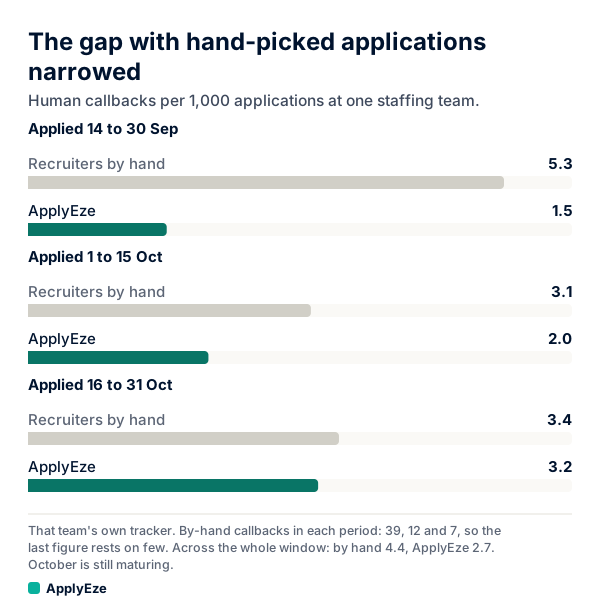
The callback counts are the columns to watch. By hand in late October rests on 7 callbacks. One more would make 291 into about 255, and one fewer would make it about 340. ApplyEze's 312 rests on 128, so one callback either way moves it by about 2. Those two late-October figures look close, and only one of them is sturdy. October applications are also still maturing, so both should improve.
The team's whole tracker gives a third answer, and it contains a trap.
| Team tracker, all logged rows | Applications | Human callbacks | Applications per callback |
|---|---|---|---|
| March 2026 | 7,288 | 24 | about 304 |
| October 2026 | 63,508 | 204 | about 311 |
Those look like a flat line, and they are not the same measurement. March predates ApplyEze's first application on 14 August, screening calls were barely logged then, and recruiters logged callbacks by hand. October has automatic inbox detection in the team's own tracker, and about 91% of the applications came through ApplyEze. Every one of these figures is a correct division. They differ in what went into the numerator, and that is the next section.
What counts as a callback, and why assessments are kept apart
The counts below come from ApplyEze's callback detection, which is rolling out with staffing teams first and is not part of self-serve accounts yet. A scan of about 29 candidates' application inboxes at this team, first run on 3 November and reading back to 4 October, labelled these emails. These are machine labels and no person reviewed them, so read "found", not "confirmed". Timing covers only the emails tied to one specific application, and recent applications have had less time to get a reply.
| Kind | Who is on the other end | Found | Tied to an application | Median time after applying |
|---|---|---|---|---|
| Assessment invitation | Mostly automatic | 465 | 279 | 0.2 hours |
| Screening call | A person checking basics | 196 | 85 | 98.1 hours |
| Interview | A person evaluating you | 140 | 54 | 126.8 hours |
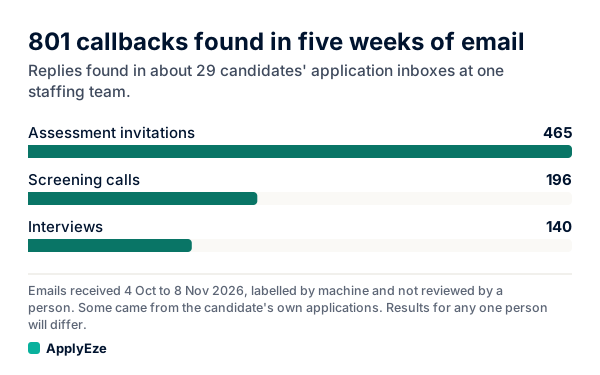
The chart shows how much the assessment bar dominates: 465 of 801. Half of those tied to an application arrived within about 12 minutes, and an email that comes back that fast is rarely a sign that someone read the application.
Now the blending test. Count everything in that chart as a callback and you have 801 instead of 336, about 2.4 times as many. Apply that ratio to our headline, and 367 becomes about 154 (367 × 336 ÷ 801). The windows differ, so this is only an illustration, but it shows the size of the lever. One definition moves the figure that far, which is why ours leaves assessments out.
Screening and interview also need separating. A phone screen checks whether you are worth an interview, and it can end there. An interview is a person evaluating you for the role. Keep them apart in your own log. The per-candidate version, by stage and month, is in callbacks per candidate.
What this means for planning your own volume
Do not borrow 367. It describes a staffing team sending about 70 applications a day per candidate in October, and it is no guide to you in either direction. Outside figures measure other things again. Ashby's 291 applications per hire is a recruiter's count across every applicant to a role. Huntr's finding that, of people whose first offer took at least 11 applications, 65% got it within 50 counts offers among self-trackers. Published interview rates count different people and different events, so do not set them beside these figures. Our guide to how many applications it takes walks through those sources.
Work out your own in four steps.
1. Find your number. Take your last 30 to 50 applications that are at least two weeks old. The age limit matters: in one read of 58 human callbacks at this team, the median came after 116 hours and 74% inside 7 days, so a quarter came later. Younger applications will read as misses that have not finished yet. Divide applications by human callbacks, and leave out assessments.
2. Expect silence. Here is the chance of zero callbacks if each application were independent, at sample rates. These are illustrations, not predictions.
| Your true rate | After 25 applications | After 50 | After 100 | After 200 |
|---|---|---|---|---|
| 1 in 25 | 36% | 13% | 2% | under 1% |
| 1 in 50 | 60% | 36% | 13% | 2% |
| 1 in 100 | 78% | 61% | 37% | 13% |
| 1 in 200 | 88% | 78% | 61% | 37% |
Read the diagonal. Send exactly as many applications as your rate suggests and you still have about a 37% chance of nothing. Send twice that and it is about 13%. Independence is generous, since one flaw in your resume hits every application at once, so real streaks can run longer.
3. Know what zero tells you. The rule of three says that if something has not happened in n tries, its true rate is plausibly anywhere from 0 to about 3 in n. So 30 silent applications only tell you your rate is probably under 1 in 10. They do not tell you it is zero. Three hundred silent applications say under 1 in 100, and by then it is time to change something.
4. Turn it into hours. A sample: if your number is 1 in 40 and you want 2 callbacks a month, that is 80 applications a month, or about 20 a week. At the 44 minutes people report for the whole job, that is about 15 hours a week. Now you can see whether the plan fits your week, and whether raising the rate would beat raising the count.
The figures at the top of this post are team numbers, from the team setup that includes ApplyEze Autopilot. Autopilot is set up today for staffing and recruiting teams that work with ApplyEze. If you are job hunting on your own, you can start with 50 free applications on sign-up, no card needed. You pick the matches and queue them in the desktop app, and ApplyEze fills and submits each form. That path runs on your computer, which stays on and awake until the queue finishes, and Workday and Oracle roles need a connected application inbox. We publish no rate for self-serve accounts, and on those accounts you record employer replies yourself, so your own count is the one that matters.
How to read any vendor claim about callbacks
Most of what ranks for this topic gives a percentage and little else. One example: LoopCV, an auto-apply tool and a competitor of ours, says on its callbacks guide that "even a perfect resume" gets a callback rate of 2 to 3%. The page gives no source, sample or definition. Here is what we would do with any figure like it.
- Turn it over. 2 to 3% is one callback per 33 to 50 applications. Now you can picture it in forms and hours.
- Ask for the count. A rate with no count behind it cannot be checked. Above, one callback moved a figure from 291 to 255.
- Ask what is inside. If assessments and automatic replies are in, the number can be 2.4 times better with no change in anyone's prospects.
- Ask how old the applications are. Replies lag, so a figure measured early reads low, and two figures measured at different ages cannot be compared.
- Ask which replies count. A screening call, an interview and an offer are different events, and a figure that blends them hides which one you are getting.
We found no rival that publishes callback counts with denominators on the pages we read on 9 November 2026. That is a statement about what is shown, not about results.
Here is ours once more. Across the whole window a recruiter picking by hand earned more per application, 4.4 against 2.7 per 1,000. ApplyEze brought about three times as many callbacks, 171 against 58, and the gap narrowed through the fall. Run the same arithmetic on your own search: your first 50 applications are free, no card needed, and that is enough to start a count of your own.