

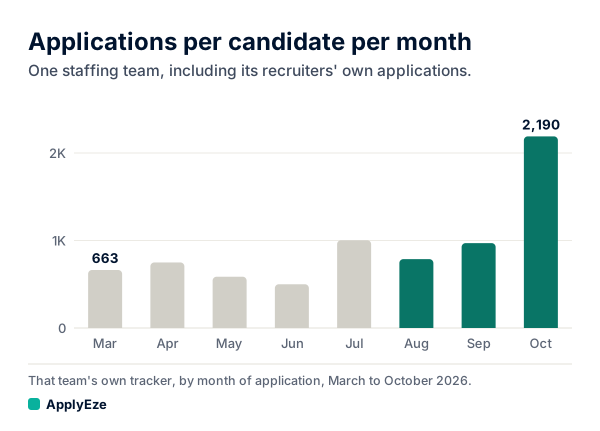
A callback rate is replies from a person divided by applications sent, and at one staffing team it held near 3 per 1,000 while volume more than tripled. From March to October 2026, applications per candidate per month went from 663 to 2,190, and human callbacks per 1,000 applications stayed between 2.8 and 4.2. That is not what you would expect, and the best outside study points the other way. Part of the rise in callbacks is better counting, and results for any one person will differ.
Here is the table, why a held rate is unusual, and what sits behind it.
The table, March to October
Applications are grouped by the month they were sent, not the month the reply came. A human callback is an application whose latest stage is a screening call, an interview or an offer. This table counts every human callback the team logged, including ones from candidates' own applications, which keeps the spring numbers high and the rise conservative. Recruiting glossaries such as Keka's use "call back rate" for the share of a recruiter's outreach calls that candidates return, which is a different number.
| Applied in | Applications | Candidates | Applications per candidate | Human callbacks | Per 1,000 | Likely range, per 1,000 |
|---|---|---|---|---|---|---|
| Mar 2026 | 7,288 | 11 | 663 | 24 | 3.3 | 2.1 to 4.9 |
| Apr 2026 | 9,736 | 13 | 749 | 29 | 3.0 | 2.0 to 4.3 |
| May 2026 | 9,963 | 17 | 586 | 28 | 2.8 | 1.9 to 4.1 |
| Jun 2026 | 9,005 | 18 | 500 | 27 | 3.0 | 2.0 to 4.4 |
| Jul 2026 | 13,033 | 13 | 1,003 | 47 | 3.6 | 2.7 to 4.8 |
| Aug 2026 | 13,380 | 17 | 787 | 41 | 3.1 | 2.2 to 4.2 |
| Sep 2026 | 21,335 | 22 | 970 | 90 | 4.2 | 3.4 to 5.2 |
| Oct 2026 | 63,508 | 29 | 2,190 | 204 | 3.2 | 2.8 to 3.7 |
The last column is our arithmetic, an exact Poisson 95% range on each month's count. The eight months together hold 490 callbacks on 147,248 applications, or 3.3 per 1,000. That average sits inside seven of the eight ranges, and September misses narrowly. So on the numbers as logged, the swing from 2.8 to 4.2 is about what chance gives you at these counts, and "held" is a fair word.
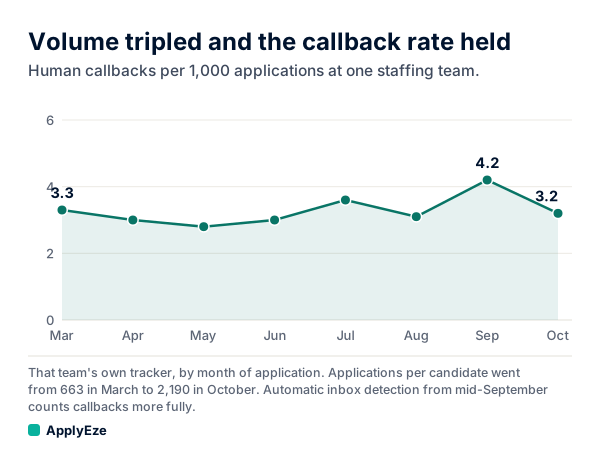
The chart draws the "per 1,000" column: a flat line near 3, with a bump in September. The next one draws applications per candidate, the column that did not stay flat. It wanders between 500 and 1,003 until September, then more than doubles in October.
Why a held rate is the surprise
An average hides what the next application is worth. Anyone's list of well-fitting roles is finite. Send more and you reach further down the list, so each extra application should be worth less than the ones before it. Employers add friction too. Ashby, for one, lets customers "limit the number of times a candidate can apply" to their jobs over a set period. At 2,190 a month, about 70 applications a day go out for each candidate.
So you would expect the rate to sag. Here the extra applications appear to earn about the same as the average. From March to October, each candidate gained 1,527 more applications a month and 4.8 more callbacks. That is about 3.1 per 1,000 for the extra applications, against about 3.3 on the whole. At this team, the 2,000th application appears to do about as well as the 200th.
ApplyEze's own numbers at this team show the same thing through the fall. Its rate rose from 1.53 per 1,000 in late September to 3.20 in late October, on more than seven times the applications (5,245 to 39,968). Over the whole window from 14 September to 31 October, a recruiter picking by hand earned more per application, 4.4 against 2.7. ApplyEze brought about three times as many callbacks, 171 against 58, and the gap narrowed, with October still maturing.
What Huntr saw when the same people sent more
The best outside evidence is Huntr's Q3 2026 report: "We compared the same 4,456 job seekers across their own weeks." In weeks at three or more times their usual pace, their interview rate fell from 9.5% to 5.6%, and their interviews per month rose from 0.7 to 2.9. Usual weeks averaged 2.5 applications and their busiest averaged 17.5.
Run the arithmetic on that and the extra application is worth about half the average one. Usual weeks give 2.5 × 9.5% = 0.24 interviews. Busy weeks give 17.5 × 5.6% = 0.98. So 15 extra applications bring 0.74 extra interviews, about 4.9% each, against 9.5% before. More volume brought more interviews, at a falling return.
Compare the shape only, never the level. Huntr's percentages and our per-1,000 figures count different people and different events. The shapes look like this:
| Huntr, same people, busy weeks against usual weeks | One staffing team, October against March | |
|---|---|---|
| Volume multiplied by | 7 | 3.3 |
| Change in the rate per application | Down 41% | Down about 3% |
| Results multiplied by | 4.1 | 3.2 |
| Same people on both sides | Yes | No, 11 candidates then 29 |
| Same counting on both sides | Yes, self-logged | No, it changed in mid-September |
| Volume reached | 17.5 a week | About 70 a day |
Huntr's comparison is cleaner on people and counting, and ours reaches far higher volume. Both point the same way on what a candidate cares about most: more applications brought more results. Huntr also warns that same-person comparisons "do not remove differences in timing or in the jobs people chose".
What could move this line
Better counting. That team's own tracker began detecting replies from inboxes automatically in mid-September. Before that, recruiters logged callbacks by hand, so part of the rise is better counting. Screening calls were also barely logged before about July, so spring's rate leaves some of them out.
A different process, not the same one run faster. ApplyEze's first recorded application was on 14 August, so March to July cannot include it. In October about 91% of this team's applications went through ApplyEze (57,587 of 63,508). So the table shows one method at low volume and mostly another at high volume, landing on similar rates. That is the finding, and it may also be partly coincidence.
Different people. The team went from 11 candidates to 29, and this table does not hold the candidates fixed.
October is still maturing. This one pushes upward. In one read of 58 human callbacks at this team, the median came 116 hours after the application and 74% came within 7 days, so about a quarter took longer. October's rate should rise as those replies arrive, and we use that lag to plan volume in applications per callback.
The table uses each application's latest stage, so a screening call that becomes an interview moves up later. We break the per-candidate version down by stage in callbacks per candidate.
These are team numbers and promise nothing to any one reader. It is one team, results for any one person will differ, and a rate at this volume does not tell you what you would see at 20 applications a week. For the published person-side numbers, see how many applications it takes to get a job. For the case against volume, see mass applying to jobs.
Where ApplyEze appears in this table, it is the team setup that includes ApplyEze Autopilot, which is set up today for staffing and recruiting teams that work with ApplyEze. If you are job hunting on your own, you can start with 50 free applications on sign-up, no card needed. You pick the matches and queue them in the desktop app, and ApplyEze fills and submits each form. That path runs on your computer, which stays on and awake until the queue finishes, and Workday and Oracle roles need a connected application inbox. We publish no rate for self-serve accounts.
How to test your own rate
What you can use is the method. Whatever your volume, work out what your extra applications earn, because the average will not tell you. A sample, with invented numbers:
| Sample period | Applications | Interviews | Rate |
|---|---|---|---|
| Usual weeks, 10 a week for 4 weeks | 40 | 3 | 7.5% |
| Busy weeks, 30 a week for 4 weeks | 120 | 5 | 4.2% |
| The extra applications | 80 | 2 | 2.5% |
The average dropped from 7.5% to 4.2%, which sounds bad, and total interviews went up, which sounds good. The useful line is the third: 40 extra applications for each extra interview. Now ask whether that is worth your hours. Two rules keep the number useful. Count only applications at least two weeks old, since replies lag. And run the one-reply test: if one more or one fewer interview changes your decision, keep measuring before you change anything.
To run that test on real numbers, you need a busy month to compare against a usual one. Your first 50 applications are free, no card needed, and they give you a busy period to measure without the evenings it would take by hand.