

To get into data analytics, learn SQL first, build a small portfolio around three questions a business would really ask, and apply under more titles than "data analyst". That last step gets the least attention and may matter most. On the 83 company job boards we read on 9 November 2026, 13 US postings were titled data analyst or business intelligence analyst. Another 62 were analyst roles named for a business function, such as finance, risk or operations, and 32 of the 55 distinct ones named SQL. Below is what to learn in what order, three project briefs on real public data you can start this week, what certificates do and do not prove, and the titles to put on your list.
What an analyst is hired to do
An analyst is hired to answer a question that someone will act on. Dashboards and queries are how that gets done. Elena Grewal, describing Airbnb's analytics track in a 2018 article, put it as "asking a great question, exploring cuts of the data in a revealing way, automating analysis through dashboards and visualizations, and driving changes in the business as a result of recommendations."
The postings agree. We read the 13 data analyst and BI analyst postings on those boards through Greenhouse's public job board API. All 13 named SQL, 11 named dashboards, and 12 mentioned stakeholders or cross-functional work. That last figure is the part most learning paths skip. A portfolio of charts shows that you can draw. It does not show that you can tell a manager what to do on Monday.
SQL first, then the rest
The order below comes from counting what those postings name, on one system and mostly at technology firms, so treat it as rough:
| Skill | Data analyst and BI postings (13) | Other analyst titles (55) |
|---|---|---|
| SQL | 13 | 32 |
| Excel or Google Sheets | 5 | 26 |
| A BI tool such as Tableau, Looker or Power BI | 9 | 20 |
| Python or R | 9 | 14 |
The depth expected varies. Brex's Data Analyst II wants "Fluency in SQL to manipulate data and perform complex analyses (CTEs, window functions, joins across large datasets)". A senior financial analyst role at Databricks asks for "Prior experience using SQL or willingness to learn". So a finance route forgives thin SQL if your spreadsheet modeling is strong, while a data analyst title does not.
"Knowing SQL" should mean you can do these without looking anything up:
- Join two tables and explain why the row count changed.
- Group and filter, and know the difference between
WHEREandHAVING. - Handle
NULLin a join and an average without silently losing rows. - Write a common table expression so a long query reads in steps.
- Use a window function, such as
LAGfor month over month change orROW_NUMBERto pick each customer's first order. - Build a retention table: of the customers who first bought in March, how many bought again in April, May and June.
If you can do number 6 from a blank file, you can handle most of what an early SQL screen is likely to ask, in our judgment. You need almost no setup, because DuckDB can query a Parquet or CSV file directly with SQL on a laptop.
After SQL, learn the spreadsheet tool well enough to build a small model, then one BI tool, picked from postings you actually want. Learn Python or R when your target postings ask, which was 9 of 13 for data analyst titles and only 14 of 55 for the others.
A portfolio of three real questions
These three briefs are written so each one answers a decision, needs real SQL, and maps onto a kind of title you can apply to. We have not run them, so the findings are yours.
Brief 1: operations. "Which 311 problem types miss their usual closing time most, and where would one more crew help?" Data: New York City's 311 Service Requests from 2020 to Present, updated daily, with created date, closed date, agency, problem type and borough. Compute median and 90th percentile days to close by problem type, agency, borough and month. Traps: requests still open have no closed date, and one incident can draw several requests. Finish with one recommendation for a borough operations manager. Maps to operations analyst titles.
Brief 2: product and strategy. "Did the Manhattan toll change taxi trips, and where?"
Data: the city's taxi trip records, published monthly as Parquet with about a two-month delay, including a cbd_congestion_fee column from 2025. Tolling began on 5 January 2025 for vehicles entering Manhattan at or south of 60 Street. Compare pickups inside and outside the zone, year over year, so seasonality does not fool you. The trap is that a before and after alone proves little, so the comparison group is the point of the exercise. Finish with what a fleet manager should do differently. Maps to product, pricing and strategy titles.
Brief 3: finance and marketing. "Which customers should a retention offer go to, and what is it worth?" Data: Online Retail II from the UCI repository, 1,067,371 transactions from a UK online seller between December 2009 and December 2011. Build monthly cohorts and repeat rates, then size the offer: how many customers, what spend, what you assume about the discount. Traps: invoices starting with "c" are cancellations, and many of the buyers are wholesalers. Finish with a number a finance lead could argue with. Maps to marketing, revenue and FP&A titles.
For each one, write a README a stranger can read in a minute. This is a template to copy, and the bracketed text is only an example:
QUESTION    [Which 311 problem types miss their usual closing time most?]
WHO ASKS    [A borough operations manager]
ANSWER      Two sentences, with the number, first.
WHAT I'D DO One action, and what it would cost or save.
DATA        Source, date range, row count, what I removed and why.
METHOD      Three lines. Link to the .sql file.
LIMITS      What this cannot tell you, and what would change my mind.
CHART       One, labeled so it needs no caption.
One warning. Do not lead with the capstone from Google's certificate. It is a fine exercise, but it is the Cyclistic bike-share case, and when we searched for it on 9 November 2026, nearly all of about 20 results were other people's write-ups of the same project. Forms offer a slot for your own work often enough: 9 of the 13 had a website box and 3 named GitHub, all optional. We found no count of how often hiring teams open these links, so build it for the interview too, since the work gives you what to say when someone asks you to walk through an analysis.
Certificates: what they do and do not prove
None of the 13 data analyst postings and none of the 55 other analyst postings named a data certificate such as Google's or Microsoft's PL-300. That is one system and a plain text match, and a certificate can still help you learn.
| Credential | What the page says | What it shows | What it does not show |
|---|---|---|---|
| Google Data Analytics Certificate | Nine courses, 6 months at 10 hours a week, no experience required | You finished a structured course in spreadsheets, SQL, Tableau and a programming language | That you can choose a question or defend an answer |
| Microsoft PL-300, Power BI Data Analyst | 100 minute proctored exam, renewed free online every 12 months, price varies by country | You can model and visualize in one tool | Anything outside Power BI |
| A degree | Mentioned in 5 of 13 data analyst postings and 32 of 55 others | A filter you pass or do not | Current skill |
Google's page also claims "82% of U.S. program graduates report a positive career outcome within 6 months of completion". Treat that as a vendor claim. A footnote on the page defines that as a new job, promotion or raise, from a 2022 US graduate survey. The sentence sits in a passage about Google's IT Support certificate, so it does not measure data analyst hiring.
A good use of a certificate is as the first month of a plan that ends in the briefs above. It is a weak substitute for them.
Analyst work hiding under other titles
Our count across those 83 boards was 13 data analyst or BI titles, 24 analytics engineer titles, and 62 analyst titles named for a business function, after leaving out managers and systems analysts. We read the 55 with distinct titles:
| Title group | Read | Named SQL | Excel or Sheets | BI tool | Example titles |
|---|---|---|---|---|---|
| Finance | 23 | 11 | 17 | 6 | FP&A Analyst, Strategic Finance Analyst, Senior Financial Analyst |
| Risk and fraud | 11 | 8 | 3 | 3 | Risk Analyst, Clearing Risk Analyst |
| Operations | 11 | 6 | 3 | 5 | Sales Operations Analyst, Payment Operations Analyst |
| Product and pricing | 6 | 3 | 1 | 3 | Senior Product Analyst, Senior Analyst, Pricing & Monetization |
| Marketing, growth | 2 | 2 | 1 | 1 | Senior Marketing Analyst |
| Business, strategy | 2 | 2 | 1 | 2 | Business Analyst, Strategy Analyst |
Those counts are small and lean to technology and finance firms. Marketing in particular is under-counted here. But the pattern fits the wider pool. In our 1% sample of about 900,000 active jobs on 9 November 2026, data analytics is a few thousand open roles, while operations is roughly 74,500, finance and accounting roughly 54,000, and marketing roughly 48,500. Most of those are not analyst jobs, but it is where many analyst jobs live.
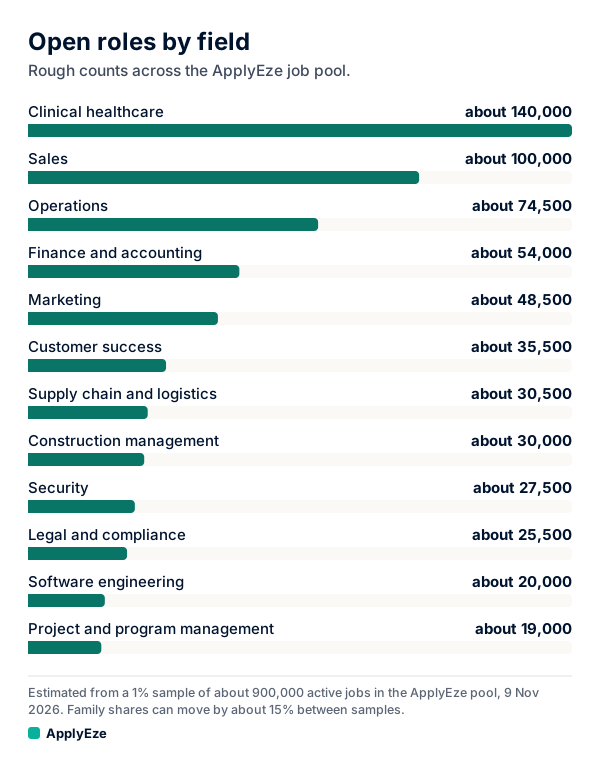
That chart runs from clinical healthcare at about 140,000 and sales at about 100,000 down to project and program management at about 19,000, and data analytics is too small to appear on it. Choose the titles closest to work you have already done:
| Your background | Titles to list first |
|---|---|
| Accounting, bookkeeping, banking | FP&A Analyst, Financial Analyst, Risk Analyst |
| Customer support, success | Customer Operations Analyst, CX Analyst |
| Warehouse, logistics, retail management | Operations Analyst, Supply Chain Analyst |
| Marketing coordination, ads | Marketing Analyst, Growth Analyst |
| Compliance, claims, investigations | Fraud Analyst, Risk Operations Analyst |
| Software, QA | Product Analyst, Analytics Engineer |
Analytics engineer is a later step: all 15 we read named SQL and 14 named Python or R, and 10 named dbt. More on ordering a title list is in target job titles. If you are weighing the next step up, our data science resume post shows how those roles differ.
What the numbers say
Our data analytics row rests on 44 sampled postings, so "a few thousand" is as precise as it gets, and a second sample moved field shares by up to about 15%. Its median advertised pay of about $103,000 is thin, since only about 15% of postings across the pool state pay. The chart below does not include it, and shows larger fields instead.
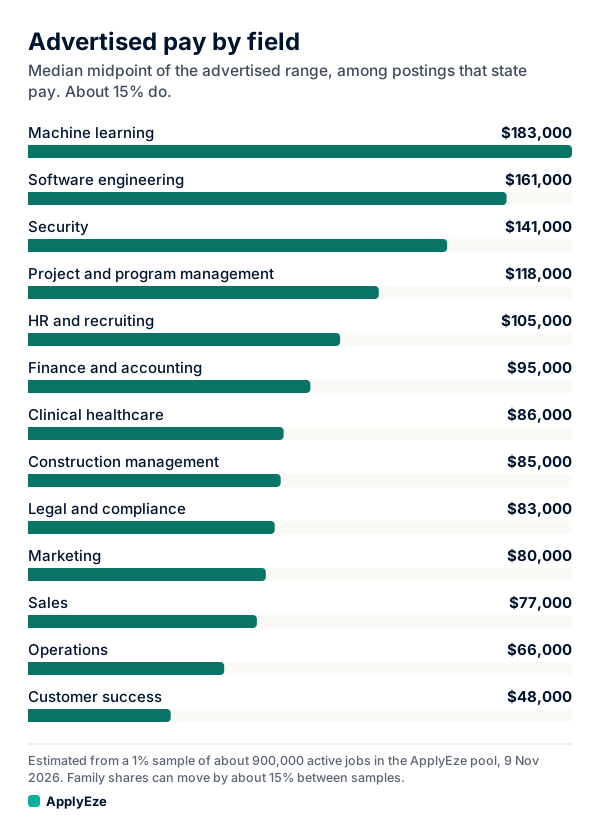
That chart runs from machine learning at $183,000 down to customer success at $48,000. Finance and accounting sits at $95,000, marketing at $80,000 and operations at $66,000. Those cover whole fields, not analysts alone. Be careful with government figures too. The Bureau of Labor Statistics handbook sends "Data Analytics Specialist" and "Data Mining Analyst" to its data scientists page, where it reports a $120,230 median wage in May 2025 and 35% growth from 2025 to 2035. That is a data scientist number, not an analyst one. The nearest analyst page we opened, operations research analysts, shows $88,940 and 12%. It is a narrower job too.
Your first analyst application
- Pick one group from the table above that your past work touches, and read ten postings in it. Note how often SQL, Excel and a BI tool come up.
- Finish one brief that maps to that group. One finished brief beats three half-done.
- Rewrite one line of your current job as analysis. This is a sample: "Handled customer escalations" becomes "Sorted 2,300 escalations by cause in a spreadsheet; showed that billing errors drove 31% and got the invoice template changed." Real numbers only. Our data analyst resume post has full samples.
- Ask for analysis work where you are now. A report your team uses is stronger evidence than a project nobody asked for, and an internal move skips the application pile.
- Prepare for several rounds. Ashby reports data roles host the most interviews of any category, 19.5 per hire, counted across everyone interviewed, not one person. You may get a live SQL exercise, so practice talking while you type.
This is where the title list pays off. ApplyEze polls more than 100,000 employer boards directly, about 900,000 active jobs, and ranks them on your target titles and the requirements it reads out of each posting. The first title you list ranks first, and you can type any job title. A role doing your work under a title you did not list ranks low, so list Financial Analyst or Operations Analyst yourself. You pick the matches and queue them in the desktop app, which fills and submits each form on your computer while it stays on and awake. It applies automatically on systems holding roughly 62% of the jobs we track with an inbox connected and roughly 23% without, since Workday and Oracle jobs stay hidden until you connect one.
It also writes a resume for each posting. ApplyEze brings a posting's named skills and tools onto your skills line, even when your own record does not list them. There is no step to remove one before a live run, so use a dry run to see what it writes, and be ready to discuss anything on the page, including a SQL or Tableau line. A certification a posting asks for is not added unless you hold it.
So finish one brief first, then apply with something to show. If you would rather spend your evenings on that brief than on forms, your first 50 applications are free, once per email address with no card, and a credit is used only when an application is confirmed as submitted.