

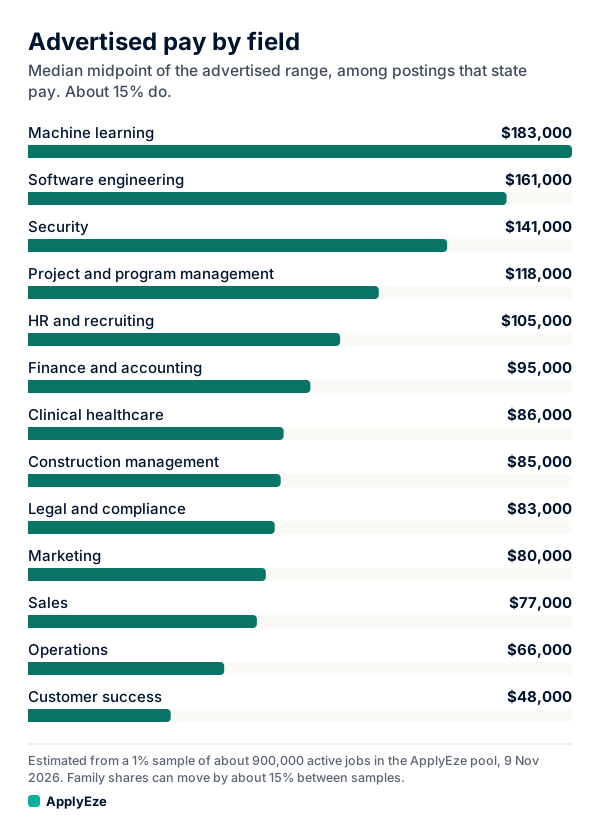
Median pay by field, as advertised, runs from $48,000 in customer success and education to $183,000 in machine learning, among the fields where we have enough postings to read. That is the midpoint of posted pay ranges in a 1% sample, taken on 9 November 2026, of about 900,000 active jobs polled directly from more than 100,000 employer boards, and it rests only on the roughly 15% of postings where we hold a pay figure. So this is a rough map of what employers advertise. It is not a salary benchmark, and below we show which numbers we would not lean on, and why.
The table
Fields with at least 100 sampled rows, sorted by pay. "Postings behind it" is our estimate, the sampled rows times the overall 15%, because the data does not count pay-stating postings per field.
| Field | Median advertised midpoint | Rows sampled | Postings behind it, rough | How far to trust it |
|---|---|---|---|---|
| Machine learning | $183,000 | 146 | about 22 | Barely enough |
| Software engineering | $161,000 | 197 | about 30 | Small |
| Security | $141,000 | 274 | about 41 | Fair |
| Project and program management | $118,000 | 188 | about 28 | Small |
| HR and recruiting | $105,000 | 123 | about 18 | Thin, looks high |
| Manufacturing | $100,000 | 117 | about 18 | Thin, mixes engineers and machinists |
| Finance and accounting | $95,000 | 542 | about 81 | Fair |
| Clinical healthcare | $86,000 | 1,395 | about 209 | Best in the table |
| Construction management | $85,000 | 298 | about 45 | Fair, looks low |
| Legal and compliance | $83,000 | 254 | about 38 | Fair, mixes very different jobs |
| Marketing | $80,000 | 487 | about 73 | Fair |
| Sales | $77,000 | 1,003 | about 150 | Good, base pay question open |
| Supply chain and logistics | $72,000 | 307 | about 46 | Fair |
| Operations | $66,000 | 744 | about 112 | Good, wide mix of jobs |
| Administrative | $50,000 | 169 | about 25 | Small |
| Customer success | $48,000 | 354 | about 53 | See below |
| Education | $48,000 | 118 | about 18 | Thin |
The chart shows thirteen of these, from machine learning at $183,000 down to customer success at $48,000. It leaves out manufacturing, supply chain, administrative and education.
How this is calculated
There are four steps, and each one takes you a little further from what a person is paid.
- We take a 1% block sample of active jobs: 9,474 rows on 9 November 2026. A second sample moved family figures by up to about 15%.
- Each posting belongs to a role family, based mainly on its title.
- Where a posting states a range, we take the midpoint. A sample: a range of $80,000 to $120,000 has a midpoint of $100,000.
- Within each family, we take the median of those midpoints.
So you are reading the middle of a set of middles. A wide range makes this slippery. A sample range of $85,000 to $175,000 has a midpoint of $130,000, but a new hire may well land far below that. And the data does not tell us how bonus, commission or hourly postings were treated across every source, which matters most in sales, where base pay and total pay can be very different numbers.
Only about 15% state pay, and that number needs care
About 15% of active jobs in the sample carry a pay figure we hold. That sounds low, because other counts are far higher. Indeed reported 59% of US postings included salary information in May 2025. The New York Fed, using Lightcast data, puts it at about 53% since January 2024.
We think a large part of the gap is how we collect pay, and it shapes this table. On systems such as Greenhouse, Ashby and Lever, our intake reads pay directly. On others, including Workday, which holds about a third of our pool, the listing feed gives us no pay figure. Those rows start blank, and a later read fills in some of them from the posting text, but not all. So our 15% is best read as a floor on how many postings state pay, and our medians lean toward postings on systems where pay is easier to read.
A second lean comes from the law. Indeed reported that as of September 2024, 97.7% of New York postings carried salary information, 90% in Washington and 88% in Colorado, against 57.8% nationally. Any sample of postings that state pay contains more of those states than a sample of all jobs would. If those employers pay above the national norm, the medians run high. Our post on job postings that list salary goes further into this.
Against what people actually earn
The best test for a rough number is a good one beside it. The Bureau of Labor Statistics publishes median wages by occupation for May 2025. We matched each field to its closest BLS occupation by hand, and turned the median hourly wage into a yearly figure by multiplying by 2,080 hours (our arithmetic).
| Field | Advertised midpoint | Closest BLS occupation | BLS median, yearly | Advertised against BLS |
|---|---|---|---|---|
| Clinical healthcare | $86,000 | Healthcare practitioners and technical, group | $86,528 | About even |
| Marketing | $80,000 | Market research analysts and marketing specialists | $78,770 | About even |
| Sales | $77,000 | Sales representatives, wholesale and manufacturing | $76,461 | About even |
| Legal and compliance | $83,000 | Compliance officers | $80,725 | About even |
| Administrative | $50,000 | Secretaries and administrative assistants, except legal, medical and executive | $47,549 | About even |
| Manufacturing | $100,000 | Industrial engineers, including health and safety | $102,669 | About even |
| Customer success | $48,000 | Customer service representatives | $44,782 | Slightly above |
| Security | $141,000 | Information security analysts | $129,189 | About 9% above |
| Finance and accounting | $95,000 | Accountants and auditors | $83,678 | About 14% above |
| Software engineering | $161,000 | Software developers | $135,990 | About 18% above |
| Project and program management | $118,000 | Project management specialists | $102,315 | About 15% above |
| Machine learning | $183,000 | Computer and information research scientists | $140,296 | About 30% above |
| HR and recruiting | $105,000 | Human resources specialists | $75,941 | About 38% above |
| Education | $48,000 | Educational instruction and library, group | $60,570 | About 21% below |
| Construction management | $85,000 | Construction managers | $114,982 | About 26% below |
| Operations | $66,000 | General and operations managers | $105,768 | About 38% below |
Three readings stand out.
The close matches are the reassuring part. A rough sample landing within about 5% of federal data for six fields suggests the postings are telling you something real, at least about the occupation that dominates the family. One of the six, manufacturing, is thin enough that the match may be luck.
Sales shows what kind of market this pool is. The BLS median for the whole sales group is $38,522, because that group includes retail. Our $77,000 sits within 1% of wholesale and manufacturing reps. Postings in this pool that state pay look like business sales, not store work.
The large gaps are mostly mismatches in what the label holds. Operations at $66,000 against general managers at $105,768 most likely means our family holds many coordinators and facilities roles alongside managers, as its title rules suggest. Construction management also takes in estimators, project engineers and any title with the word "construction" in it, so it is not a clean read on construction managers. HR at about 38% above sits on about 18 postings. It is a thin number from postings that may lean senior, and it is the one in the chart we trust least.
These comparisons are approximate. BLS covers employed people in all states, advertised midpoints cover new hires at whichever employers posted, and pay has moved since May 2025.
Why customer success may look low
At $48,000, customer success sits level with education and well below anything a customer success manager at a software company would recognize. The data does not split the family, but our title rules for it take in "customer success", "customer support", "customer service", "client success", "support specialist" and "technical account manager". So it very likely blends help desk and call center work with account roles.
The BLS check supports that. Customer service representatives have a median of $44,782, close to $48,000. If you are a customer success manager, this is not your number. Look at posted ranges for your own title and segment instead.
Thin fields, marked
We treat a family with fewer than 20 postings stating pay as thin. At an overall rate of 15%, that means any family below about 133 sampled rows (20 divided by 0.15). HR, education and manufacturing fall just under the line in the main table. Everything below falls well under it. These are not market figures, and the largest numbers are the thinnest.
| Family | Advertised midpoint | Rows sampled | Postings behind it, rough |
|---|---|---|---|
| Backend | $220,000 | 12 | about 2 |
| Product management | $205,000 | 54 | about 8 |
| Data science | $185,000 | 30 | about 5 |
| Design and UX | $165,000 | 19 | about 3 |
| Frontend | $163,000 | 32 | about 5 |
| DevOps and SRE | $160,000 | 47 | about 7 |
| Data engineering | $140,000 | 33 | about 5 |
| Electrical engineering | $122,000 | 36 | about 5 |
| Mechanical engineering | $117,000 | 43 | about 6 |
| Data analytics | $103,000 | 44 | about 7 |
| Civil and structural | $100,000 | 42 | about 6 |
| IT support | $96,000 | 34 | about 5 |
| Research | $88,000 | 18 | about 3 |
| Mobile | $84,000 | 66 | about 10 |
| Healthcare administration | $63,000 | 44 | about 7 |
| QA and test | $61,000 | 58 | about 9 |
| MEP engineering | $53,000 | 86 | about 13 |
Backend at $220,000 is the highest number we hold, and it probably rests on two postings. Frontend and backend are the same trade in many companies, so a $57,000 gap between them is noise. MEP engineering at $53,000 looks low for engineers because its title rules also catch HVAC and plumbing trades.
The per-family estimates assume each family states pay at the overall 15%. Some surely state it more often and some less, and Indeed ranked healthcare lowest among the high-earning sectors it studied, with physician postings at 44%. So the rough counts are themselves rough.
How to use this, and how not to
Good uses:
- Comparing fields broadly. Machine learning advertises at a very different level from operations, and that gap is far larger than any noise here.
- Sense-checking a career move. If an adjacent field sits $40,000 higher, it is worth a closer look at real postings. Pair it with how many roles the field has open.
- Spotting an outlier range. A software engineering posting with a midpoint of $70,000 deserves a question.
Bad uses:
- Quoting it in a negotiation. It has no level, no city and no company size.
- Separating close fields. Construction at $85,000 and legal at $83,000 are the same number in this data.
- Filling in a desired salary field. For that, use the posted range or BLS metro wages, as our guide to what to enter for desired salary sets out.
- Assuming a posted midpoint is what a new hire gets. In Illinois, the state says outright that nothing limits an employer to the posted range when making an offer.
A good next step is one comparison: your field, the adjacent field you are weighing, and ten real postings from each.
ApplyEze's setup asks for your salary, and its ranking reads pay where a posting states it, as one part of a fit score from your role, skills, industry, level, education, experience and pay. You pick the matches and queue them in the desktop app, which fills and submits each form in Chrome on your computer while it stays on and awake. Workday and Oracle jobs stay hidden until you connect an application inbox, because those sites email a code. A credit is used only when an application is confirmed as submitted. If you would rather compare ranges than retype your salary into forms, your first 50 applications are free, with no card.