

A job application completion rate is the share of started applications that actually get submitted. The pages that rank for this term are HR glossaries written for employers, and their figures run from about 5% to about 50% because each one counts "started" differently. This post adds something they do not have: what happens when software fills real forms. ApplyEze Autopilot completed 79.1% of 45,376 runs in the 14 days to 9 November 2026, from 94.5% on Rippling down to 55.5% on iCIMS. Every system is in the table, with a count beside every percentage.
The full table
Applied means the application was submitted. Released means the run ended without one, for any reason, including a posting that closed. These are runs that settled in the 14 days to 9 November 2026.
| System | Applied | Released | Runs | Applied share | Margin, in points |
|---|---|---|---|---|---|
| Rippling | 671 | 39 | 710 | 94.5% | ±1.7 |
| BambooHR | 569 | 44 | 613 | 92.8% | ±2.0 |
| Ashby | 5,944 | 784 | 6,728 | 88.3% | ±0.8 |
| Pinpoint | 111 | 16 | 127 | 87.4% | ±5.8 |
| JazzHR | 1,076 | 182 | 1,258 | 85.5% | ±1.9 |
| Workday | 12,488 | 2,830 | 15,318 | 81.5% | ±0.6 |
| SmartRecruiters | 1,535 | 386 | 1,921 | 79.9% | ±1.8 |
| Lever | 903 | 229 | 1,132 | 79.8% | ±2.3 |
| Oracle | 1,428 | 417 | 1,845 | 77.4% | ±1.9 |
| Recruitee | 118 | 41 | 159 | 74.2% | ±6.8 |
| Greenhouse | 7,445 | 2,607 | 10,052 | 74.1% | ±0.9 |
| Workable | 1,329 | 466 | 1,795 | 74.0% | ±2.0 |
| Dayforce | 789 | 285 | 1,074 | 73.5% | ±2.6 |
| iCIMS | 1,468 | 1,176 | 2,644 | 55.5% | ±1.9 |
| All 14 | 35,874 | 9,502 | 45,376 | 79.1% |
The last column is our arithmetic: a 95% margin from the standard formula for a proportion. It assumes every run is independent, and they are not, because the same employers and candidates repeat. Read it as the least uncertainty a row could have.
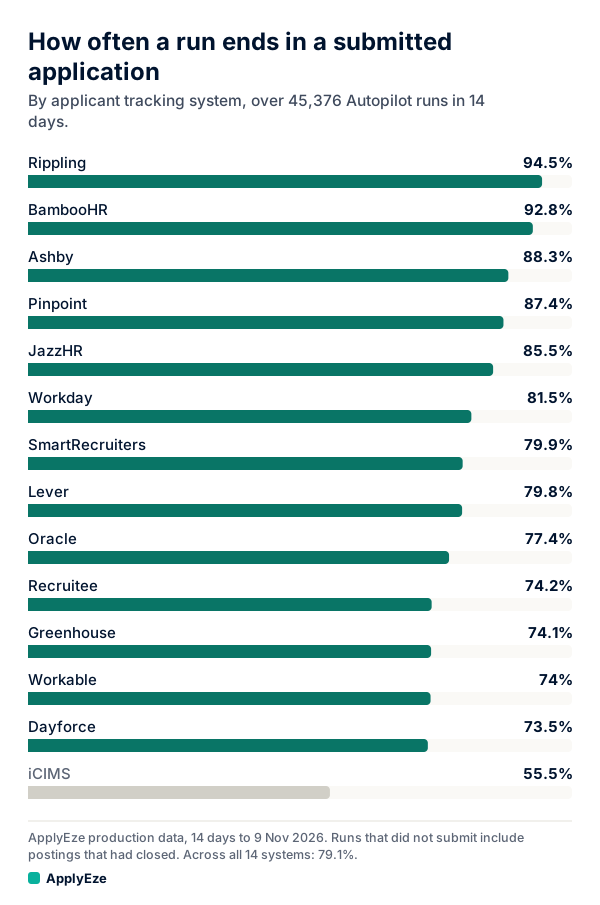
The chart shows the same order. Eight systems sit above the 79.1% overall figure and six below it, with 39 points between the top and the bottom.
Several different numbers share this name
Search for this term and you will find different events described with the same words. These are vendor figures, and several have no method on the page.
| What is being counted | Figure | Source | What to know |
|---|---|---|---|
| Clicks on a job ad that become applications | 6% in 2024 | CareerPlug | Small businesses, more than 10 million applications |
| Same event, median | 4.66% | Appcast's 2026 report, as cited by Pin | 302 million clicks in 2025 data |
| Started and finished, rule of thumb | 10 to 20% white-collar, 30 to 50% frontline | Metaview | Stated as a rule of thumb, no study named |
| Completion by form length | 12.47% under 5 minutes, 3.61% at 15 or more | Appcast | Article dated July 2016, sample not stated |
| Clicked Apply and never finished | 92% drop-off | Appcast, as reported by SHRM | No method in the article, and no reason given |
Two things follow. A click is not a start. Someone who clicks, reads the pay and leaves has made a decision, not failed a form. Pin's guide, for one, answers "what is a good application completion rate" with click-to-apply numbers, which is a different question.
And none of these can sit beside our 79.1%. A person can lose interest, run out of lunch break or decide they do not qualify. A run starts after the decision to apply has been made, and it has no phone to put down. So 79.1% is not a multiple of 6%. The denominators differ too much for a ratio to mean anything.
What applied and released mean
Applied is one state. Released is a bucket, and it holds at least four different events:
- A form that could not be finished. The failure you would expect.
- A posting that closed. The job went away before the run ended.
- A submit nobody could confirm. The site never confirmed. We release these and never replay them, because a replay could send a second application. So a released run is not proof that nothing reached the employer.
- A form that stops by rule. A form that requires your full Social Security or national ID number stops that application.
Two accounting details matter when you read the table. A run known not to have submitted, because of an infrastructure problem, goes back in the queue for at most 3 tries, so the table counts each role once, when it settles, and not each attempt. And the table does not split released by reason. A system whose postings close quickly would look worse than one whose postings stay open, with identical form filling. So read a low number as a place to look, not a verdict on the form.
The top of the list, and how small some samples are
Rippling at 94.5% and BambooHR at 92.8% lead on 710 and 613 runs. Pinpoint's 87.4% rests on 127 runs, so its margin alone spans about 82% to 93%, and it cannot be separated from JazzHR's 85.5% on 1,258 runs. Recruitee's 74.2% rests on 159 runs and could sit anywhere from about 67% to 81%.
The results that carry the most weight are the large ones. Ashby at 88.3% on 6,728 runs. Workday at 81.5% on 15,318 runs, with a margin under a point, on the system that holds roughly a third of open jobs in our pool.
Speed does not explain the order. Workday is the slowest of the 14 at a median of 4.5 minutes and still beats the overall figure, while Workable takes 1.7 minutes and sits at 74.0%. The minutes for each system are in how long a job application takes.
These ranks describe one set of candidates and employers in one window. A different mix could reorder the middle of the table.
The bottom of the list
iCIMS is the lowest here: 1,176 of 2,644 runs ended without an application, or 44.5%. Dayforce at 73.5%, Workable at 74.0%, Greenhouse at 74.1% and Recruitee at 74.2% come next. Each iCIMS employer runs its own portal with its own login, which is a fact about the system and not a measured cause of this number.
Percentages also hide where the losses are. Count them instead:
| System | Runs released | Share of all 9,502 |
|---|---|---|
| Workday | 2,830 | 29.8% |
| Greenhouse | 2,607 | 27.4% |
| iCIMS | 1,176 | 12.4% |
| The other 11 | 2,889 | 30.4% |
Greenhouse at 74.1% lost more than twice as many runs as iCIMS at 55.5%. Workday, above the overall figure, lost the most of all. Three systems account for 69.6% of every run that ended without an application (our arithmetic). A league table of percentages would send you looking in the wrong place.
Why this is not a free user's result
Everything above is ApplyEze Autopilot, which applies from ApplyEze servers for candidates a team has set up. It includes iCIMS and Dayforce, which a self-serve account does not cover. We publish no completion rate for self-serve accounts, so nothing in the table is a forecast for you.
Autopilot is set up today for staffing and recruiting teams that work with ApplyEze. If you are job hunting on your own, you can start with 50 free applications on sign-up, no card needed. You pick the matches and queue them in the desktop app, and ApplyEze fills and submits each form.
The product's own rule on failed runs: "A credit is used only when an application is confirmed as Submitted. Practice runs, skipped postings and forms that could not be finished cost nothing, and free credits are spent last."
What to ask any vendor
ApplyEze makes a product in this category. On the rival pages we read on 9 November 2026 we did not find a figure like this. Two reports come close and show why the wording matters. Scoutify's speed report covers 6,795 applications and says "Failed attempts are excluded", which is clear, and which means it cannot tell you a failure rate. AutoApplyMax's 100,000-application report gives an "ATS pass rate" by platform, for example 44% on Workday and 39% on iCIMS, but it defines a pass as reaching a human reviewer and gives no sample size per platform. Both are those companies' own figures, measuring something else.
If you are comparing tools, these questions work on any of them, including us:
- What is the denominator? Every run started, or only runs that reached the form?
- How is "applied" confirmed? A confirmation from the employer's site, or the tool's own log?
- Is it split by system, with counts? One average can hide a 39 point spread.
- Do closed postings count against the rate? Either choice is defensible. It has to be stated.
- Is a retry one run or several? Counting attempts and counting roles give different answers.
- What is the date window, and what was left out? A peak month is not a rate.
- What happens when the submit is unknown? A replay can send a second application to the same employer.
- Do you pay for a run that ends without a submission?
A finished form is one stage. Our job application funnel shows the steps around it, and what an ATS is explains the systems named here.
To try these questions on a live product, your first 50 applications are free, no card needed, and a form that cannot be finished costs no credit. You pick the matches and queue them in the desktop app, it runs while your computer stays on and awake, and Workday and Oracle roles need a connected inbox.